Measure the trust
you build
Performance analytics and peer benchmarks built for
public safety communications teams.
No complicated setup · Works on any public social profile
Great community engagement is hard to see — and
even harder to prove
Most PIOs are stitching together screenshots from three different platforms to make a case internally. There's no benchmark, no cross-department comparison, and no report designed for the people above you.
What this changes for your team
Know how your content performs across every platform in one view
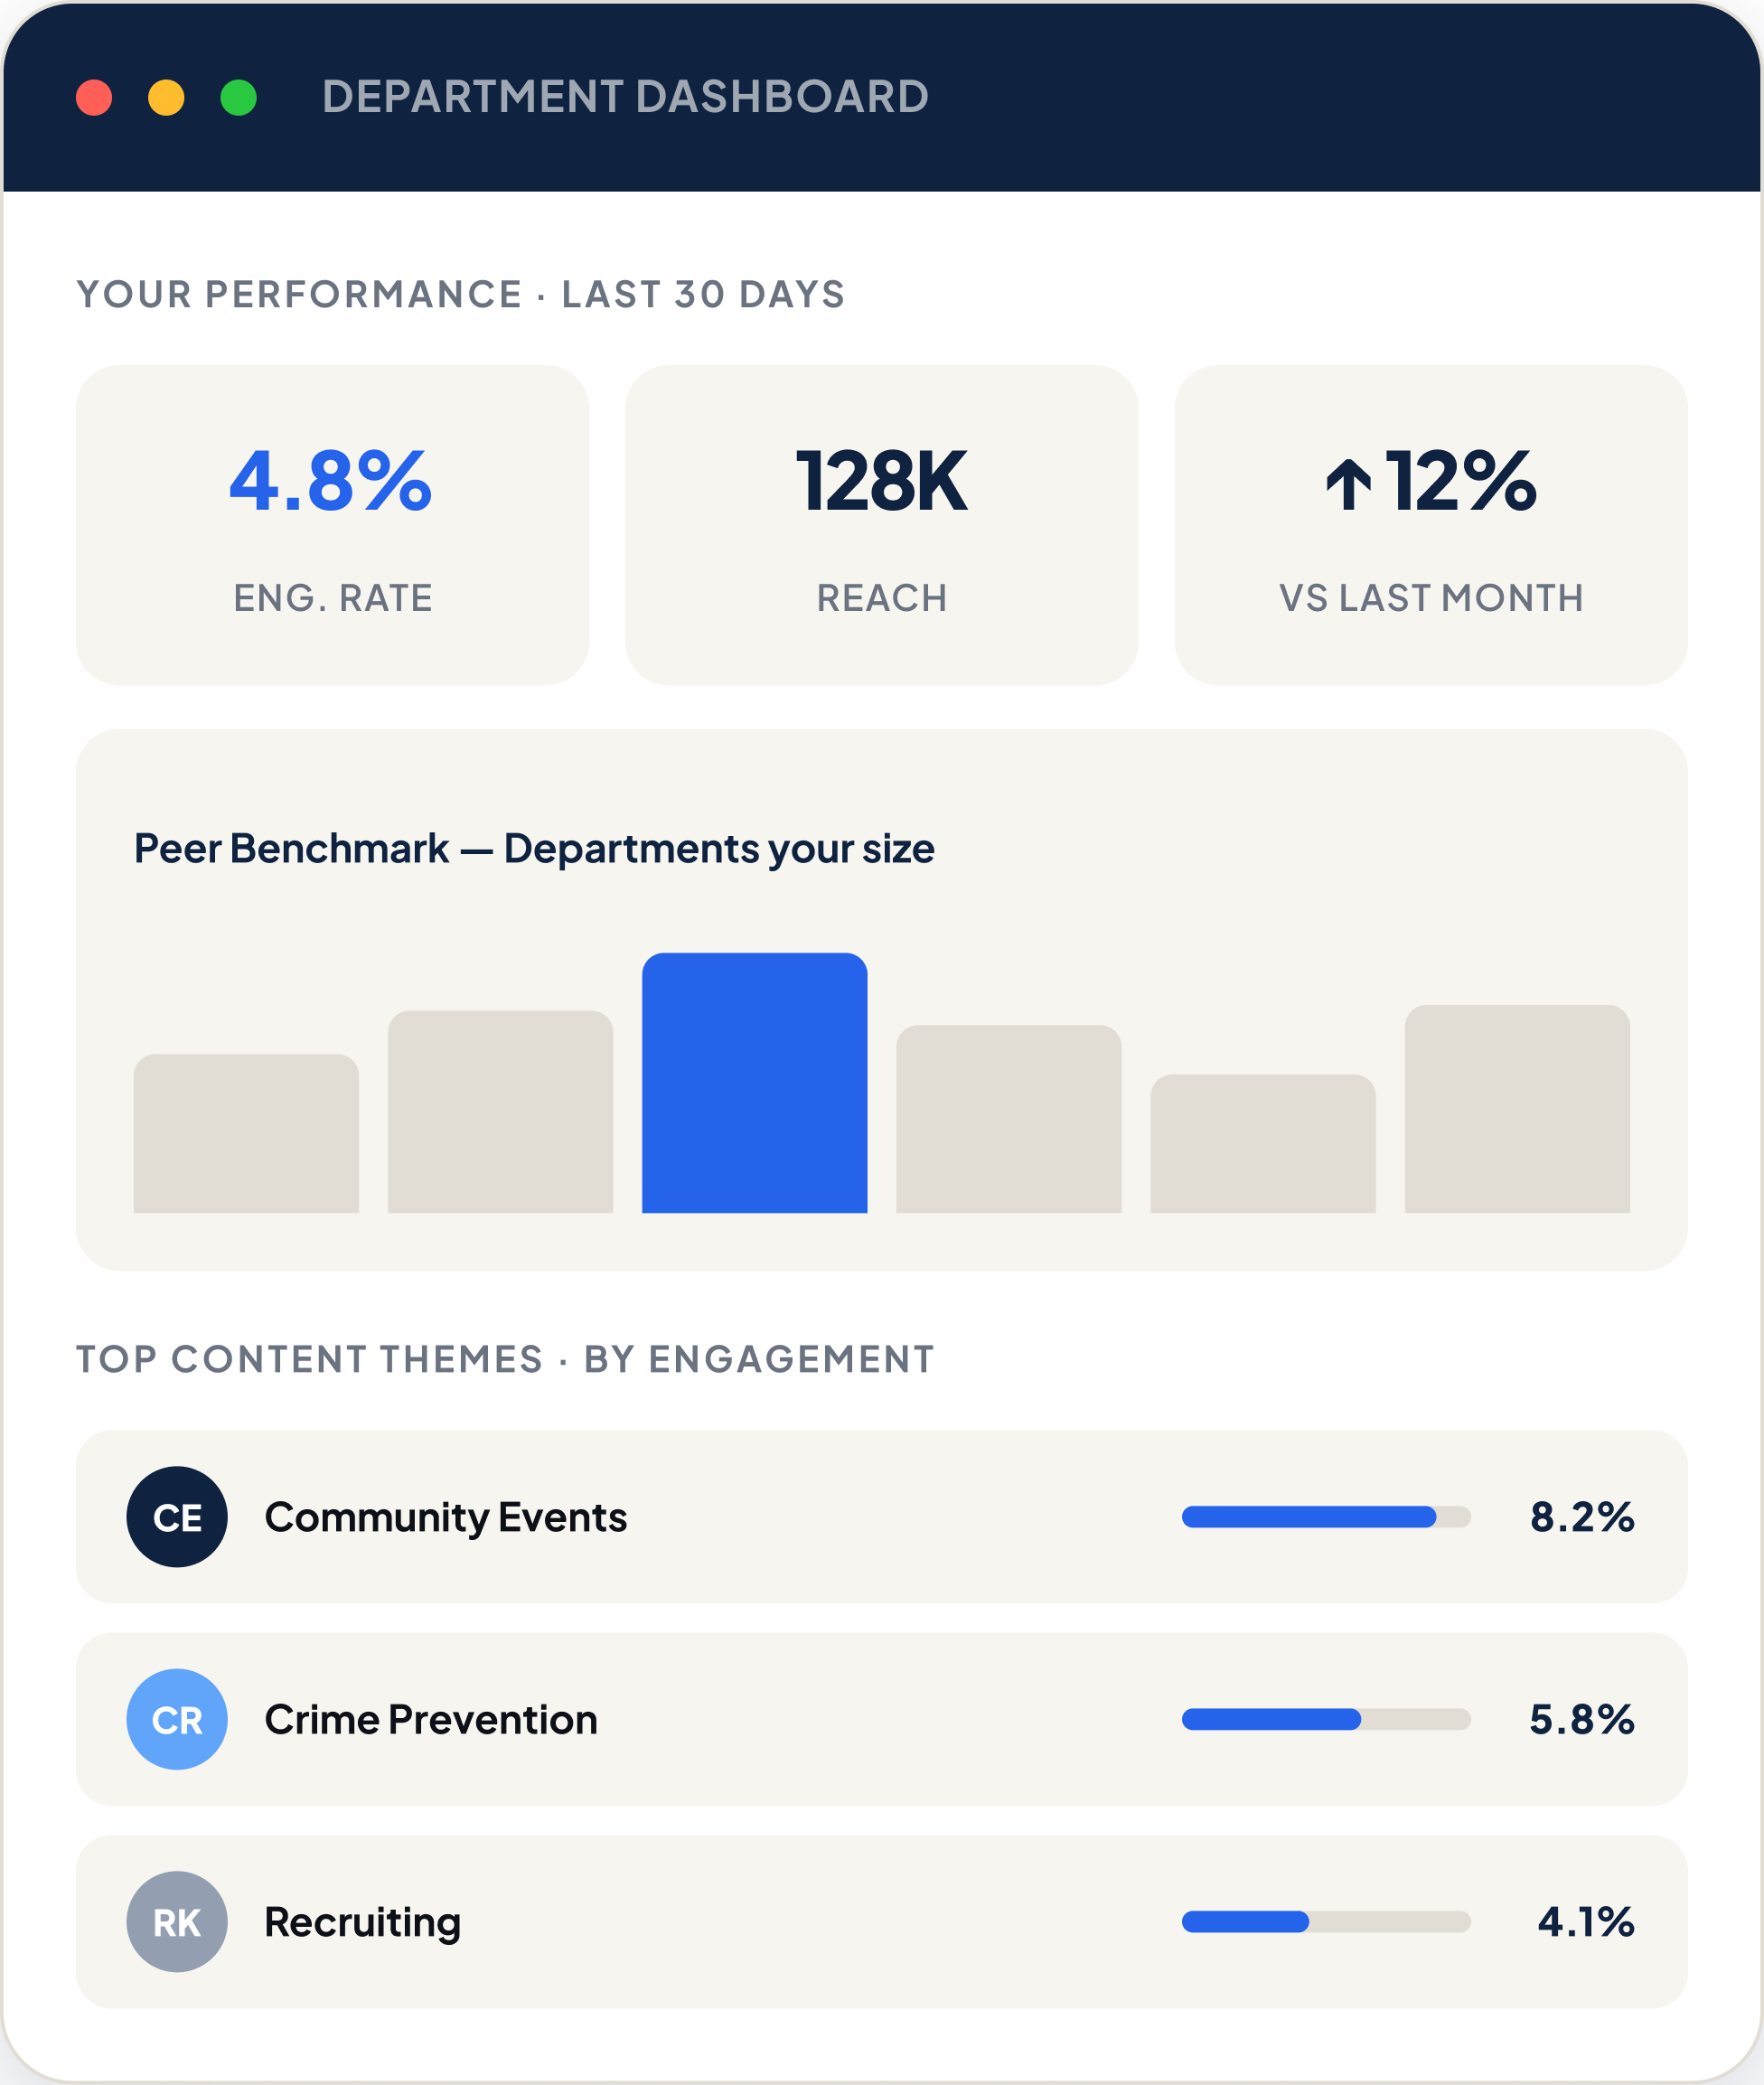
Benchmark your results against similar departments
Understand which content themes build the most engagement
Walk into any internal meeting with a report that speaks for itself
Track performance over time without stitching together screenshots
Built around the job you actually do
Peer Benchmarking
See how your department's social media performance compares to similar departments. Know if your engagement is strong, average, or where to focus next.
Content Pillar Analysis
Find out which content themes — community events, crime prevention, recruiting, crisis updates — drive the most engagement with your audience. Post less. Resonate more.
Crisis Communication Tracking
Measure how your content performed during critical incidents. Understand community response in real time and build a clear record of how your team showed up when it mattered.
Leadership-Ready Reports
Export clean, presentation-ready reports in minutes. No screenshots, no manual work — just data your chief, city council, or communications director can actually read.
Know exactly where you stand
Generic social media benchmarks are built on retail brands. Yours shouldn't be. Pick the departments you want to be measured against and see your numbers side by side.
Ready in five minutes
Add your profiles
Connect your department's social accounts across Facebook, Instagram, and X in minutes.
Select your benchmarks
Choose the departments you want to compare against. Filter by size, region, or type.
Track, report, prove
Monitor your performance, understand what's working, and export reports your leadership can act on.
Built for one job done right
Public Information Officers
Pain
You post consistently, engage your community, and manage communications solo — but you have no way to show leadership what that effort is actually worth.
Outcome
Walk into every budget conversation with benchmarks, performance data, and a report that tells the full story.
Law Enforcement Social Media Managers
Pain
You're managing multiple platforms with native analytics that don't talk to each other and give you no sense of how you compare to anyone else.
Outcome
One view across all your platforms, with peer benchmarks that show exactly where you stand.
Police Communications Directors
Pain
Your team is doing meaningful community work but reporting it upward means hours of manual data collection with no consistent format.
Outcome
Automated, presentation-ready reports your chief, sheriff, or city council can read in minutes.
Everything you need to prove your impact
Built around the challenges you face every day
No cross-platform view
↓All your social accounts in one dashboard, finally
No benchmarks for your vertical
↓Compare against departments your size, not generic industry averages
No report for leadership
↓Export clean, presentation-ready reports in minutes
Law enforcement communication is growing up.
The tools should too.
PIOs are no longer an afterthought. They're strategists, storytellers, and community builders — managing multi-platform presences, navigating crises in real time, and representing their departments to the public every single day. The profession has evolved. The analytics haven't.
91% Of law enforcement departments are active on social media. Almost none have analytics built specifically for their communications work.
Common questions
Is this a surveillance tool?
No. This tool is built entirely around your own department's social media performance. We analyze the content you publish and how your community engages with it — nothing else.
Which platforms does it cover?
Facebook, Instagram, and X. All in one view, no switching between native dashboards.
How do you benchmark against other departments?
You select the departments you want to compare against. Filter by size, region, or type — then track how your performance stacks up across engagement, posting frequency, and content themes.
How long does setup take?
Under five minutes. Add your profiles, select your benchmarks, and you're ready to start tracking.
Can I export reports for my chief?
Yes. Reports are clean, presentation-ready, and exportable in minutes. No manual work, no screenshots — just data your leadership can actually read.
Is this built only for police departments?
No. Any public safety communications team can use it — sheriff's offices, fire departments, transit authorities, and federal departments are all welcome.
See what Socialhound shows about your department.
Book a demo and we'll walk you through a live look at your department's benchmarked performance. No commitment. No generic walk-through — we'll use your actual department's data.
See your department's cross-platform metrics in one place
Get your benchmark ranking among peer departments
Preview an auto-generated leadership report for your department
Ask any questions — no pressure, no pitch-deck theater
“Government procurement takes time. We know that. The demo is a human conversation — not a sales funnel. We'll help you figure out whether this is the right fit for your department and how to build the case internally.” — Socialhound team
Book Your Demo
30 Minutes. We'll show you real benchmarks for your department.