Measure the trust
you build
Performance analytics and peer benchmarks built for
public safety communication teams.
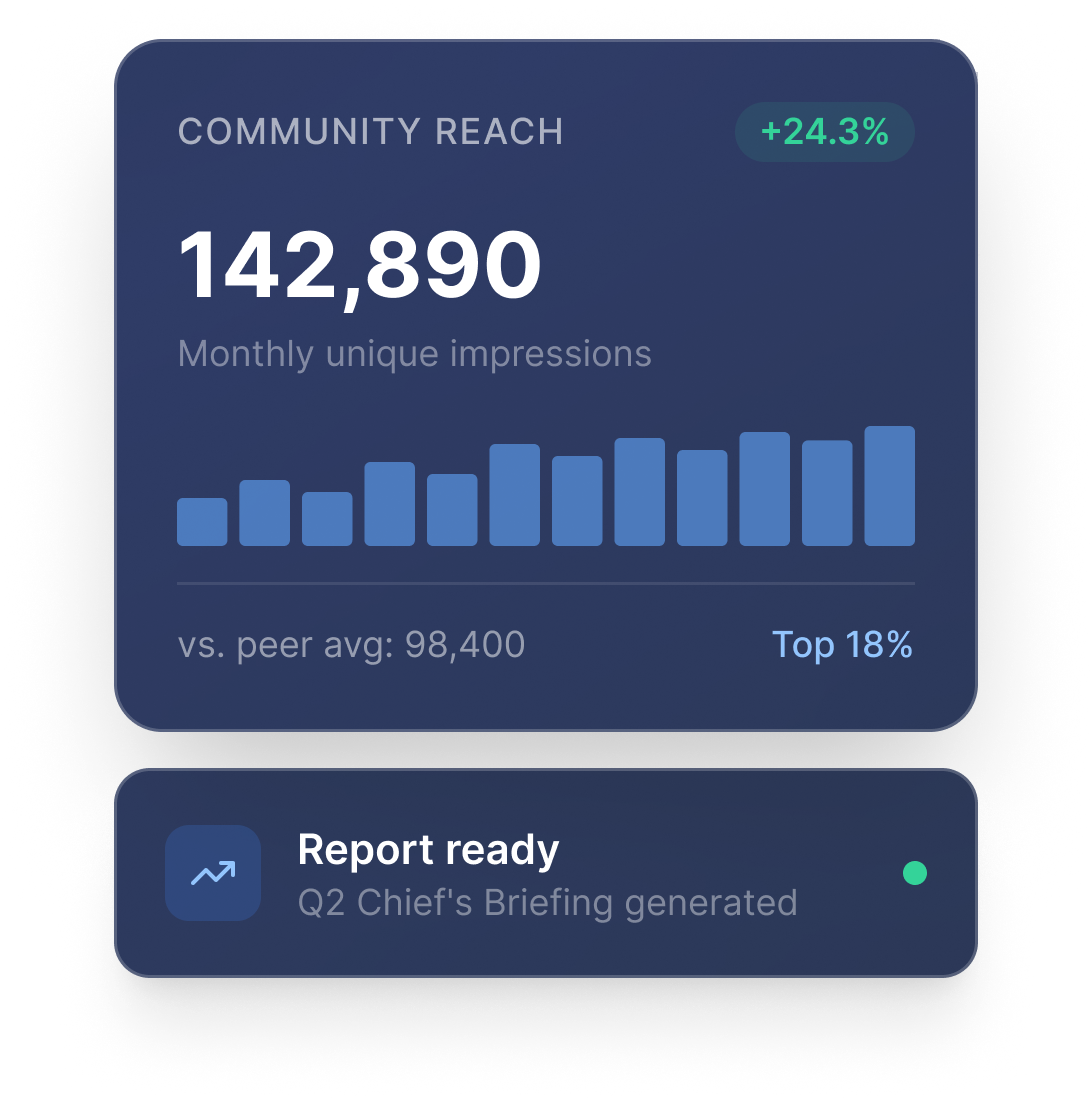
Great community engagement is hard to see
and even harder to prove
Most teams are stitching together screenshots from multiple dashboards to make a case internally.
There's no benchmark, no cross-department comparison, and no report designed for the team
How is our social media performing this quarter?
You open four different platform tabs, export CSVs, and spend three hours in a spreadsheet building something that still doesn't tell leadership what they actually want to know.
Are we doing better or worse than other departments our size?
Nobody can answer this. There's no instrument. You're measuring yourself in a vacuum with no reference point for what "good" looks like in law enforcement.
Can you put together a report for the chief's briefing next week?
You pull screenshots from Instagram Insights, copy follower counts from Facebook, and build a slide deck from scratch — again. Every single time.
Everything the team needs. Nothing
they don't.
PrecinctSocial is built around three jobs: measure your performance, benchmark against peers, and report to leadership. That's it. No surveillance. No scheduling. No feature bloat
Unified Cross-Platform Analytics
Stop switching between Facebook Insights, Instagram, and X Analytics. See all your department's social performance in one dashboard: reach, engagement, follower growth, and post-level metrics across every channel.
One view. All platformsDepartment-vs-Department Benchmarking
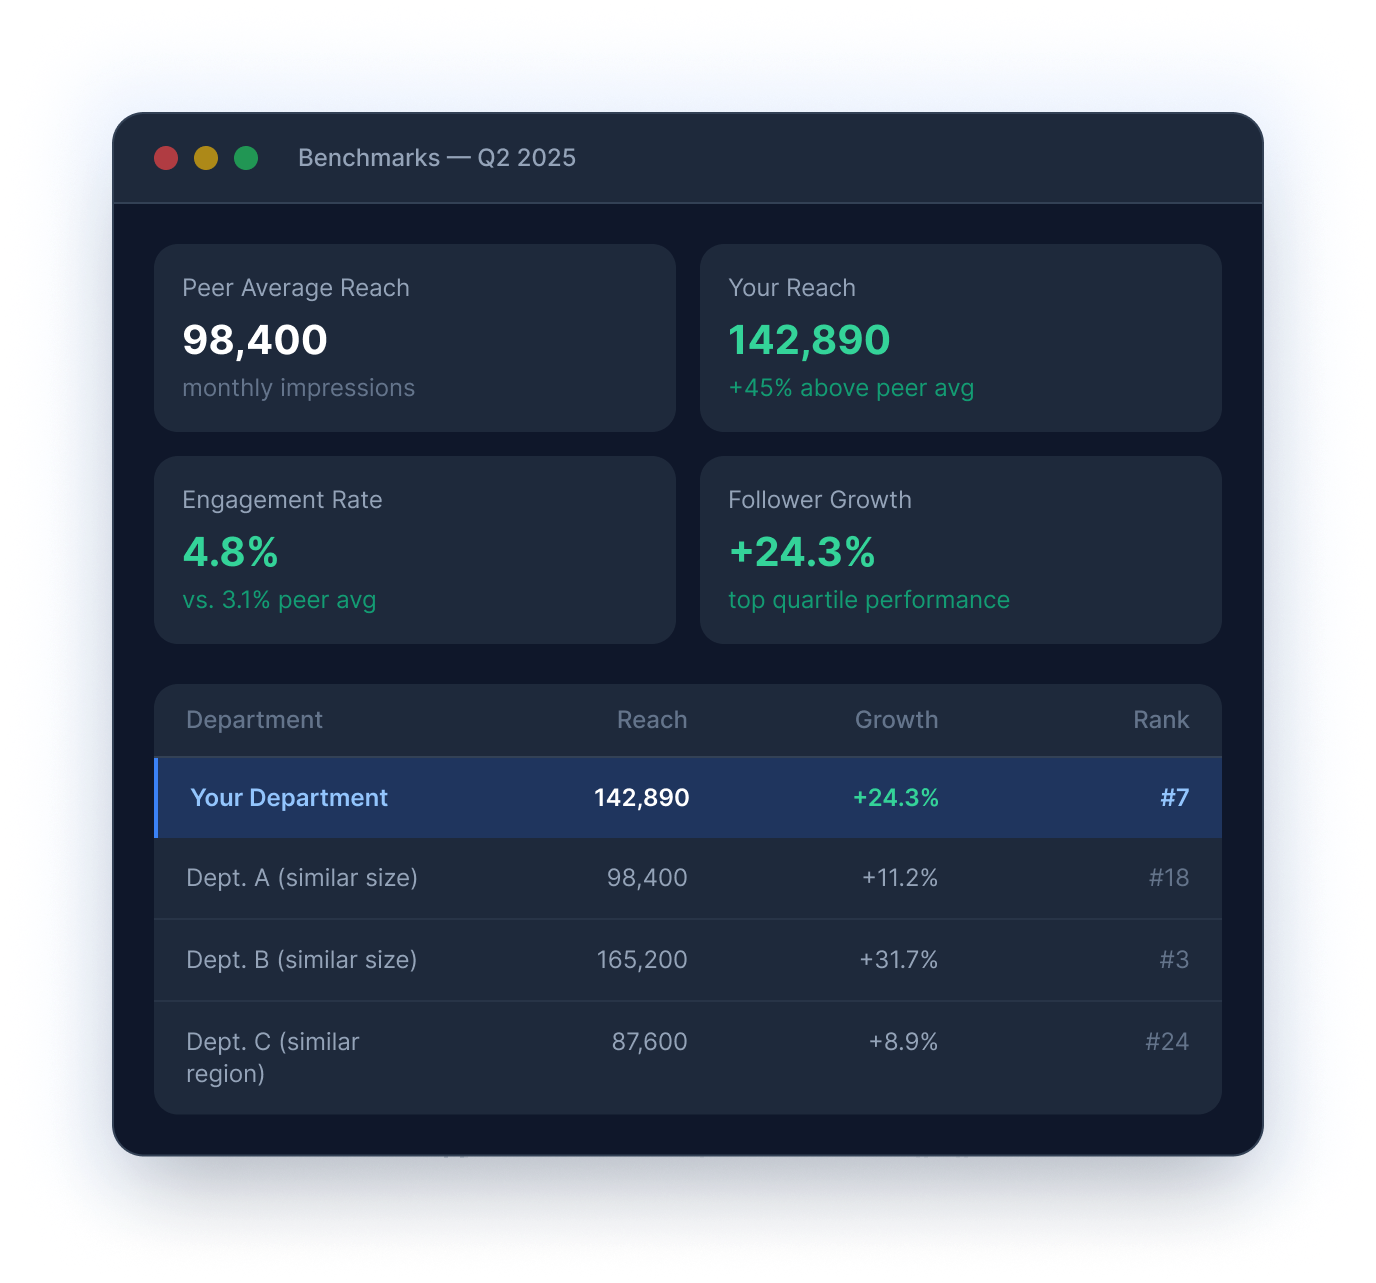
The question every PIO has but can't answer: "Are we good at this?" Now you can. Compare your performance against departments of similar size, region, and type. See exactly where you rank.
First of its kind in law enforcementLeadership-Ready Reports
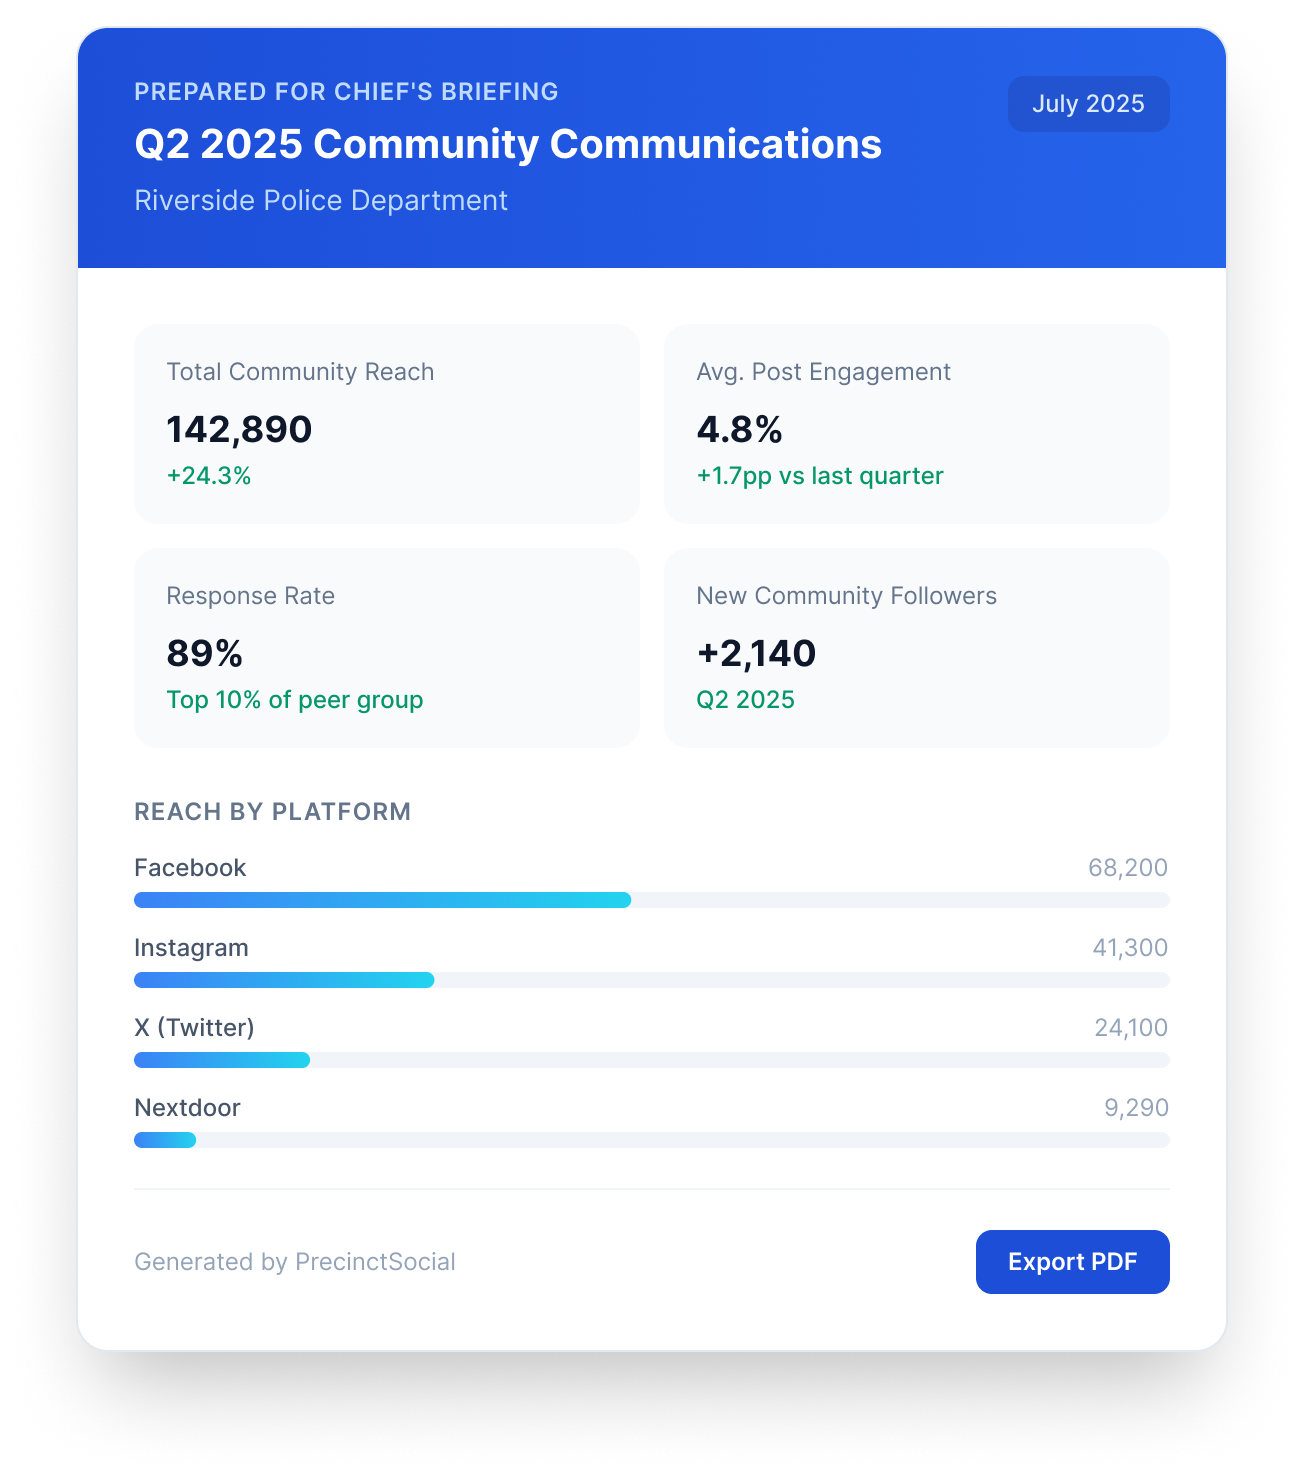
Generate clean, professional reports in minutes. Framed in community impact language your chief and city council actually understand: reach, response growth, community trust signals. Not marketing jargon.
Budget meeting ready in minutesPerformance Trends Over Time
Track how your department's communication strategy evolves. Spot what content resonates most with your community, identify your strongest periods, and build a data-backed story of continuous improvement.
Show progress, not just snapshotsPeer Group Intelligence
Grouped by jurisdiction size, geography, and department type, your benchmark cohort is built to be meaningful - not a meaningless average of every account on the internet.
Compare what mattersCommunity Reach Metrics
Go beyond vanity metrics. Understand true community reach, engagement quality, and audience growth in terms that translate directly to the language of public trust.
Language leadership understandsStop guessing.
See where you rank.
The IACP benchmarks budgets and staffing. Now there's the equivalent for social media. Compare your department's performance against peer agencies grouped by size, region, and type - the one question every PIO has and nobody was answering.
Reports that speak
leadership language.
The leadership cares about community reach, response growth, and whether the department's communication is building trust. Dispatch reports are written in that language.
The moments when data matters
most.
PIOs know their work has impact. Dispatch makes sure everyone else knows it too, exactly when it counts
Budget Season
New Chief or Leadership
After a Crisis
Peer Department Comparison
See what Dispatch shows about your department.
Book a demo and we'll walk you through a live look at your department's benchmarked performance. No commitment. No generic walk-through — we'll use your actual department's data.
See your department's cross-platform metrics in one place
Get your benchmark ranking among peer departments
Preview an auto-generated leadership report for your department
Ask any questions — no pressure, no pitch-deck theater
“Government procurement takes time. We know that. The demo is a human conversation — not a sales funnel. We'll help you figure out whether this is the right fit for your department and how to build the case internally.” — PrecinctSocial team
Book Your Demo
30 Minutes. We'll show you real benchmarks for your department.
Start measuring the trust
you build.
No complicated setup. Works on any public social profile.